


Lately, more leaders in the recruitment industry are talking about talent density and quality of hires. It is the No. 1 priority for recruiters in 2024. While companies and their top leadership continue to track recruitment metrics & KPIs like time-to-hire, time-to-fill, and cost-per-hire, there is an increasing interest in the quality of talent as well. 54% of recruiting specialists consider the quality of hire (QoH) as a key factor that will shape recruitment in the next 5 years. However, companies often shy away from calculating the quality of hire recruitment metric. The reasons could vary, but one of the common reasons is the confusion about the standard formula to calculate the Quality of Hire.
There is no standard formula for calculating the quality of hire.
In essence, the quality of hire is a descriptive metric i.e., it’s a mix of quantitative and qualitative metrics.
Indeed multiple quantifiable recruitment KPIs can be the key predictors or indicators of the quality of hire. However, there are certain equally important qualitative recruitment KPIs as well, which need to be accounted for in the quality of hire formula. Thus calculating QoH is quite a tough nut to crack.
Read this insight to understand the quality of hire recruitment metric, common predictors of quality of hire, and how to calculate it precisely.
What’s Quality-of-Hire (QoH)?
In terms of the ISO/TS,
For recruitment, quality of hire relates to the satisfaction of the stakeholders with the performance of the new hire and can be assessed as the percentage of products/services that meet or exceed expectations.
Well, that’s the standard definition of quality of hire.
A more descriptive definition could be-
Quality of hire is a recruitment metric to assess and report-
- The efficiency of your overall recruitment process.
- The productivity of your recruiters.
- The performance of the new hires.
- The collection of collective talent potential held by new hires.
- The efficacy with which your organization realizes the new hire's potential.
Why Is It Complex To Calculate Quality of Hire Recruitment Metric?
It can be very complex to calculate the quality of hire if you do not understand the involved predictors. More importantly, for QoH to be a valuable metric, you need extreme clarity about what it is, and what it is not.
In essence,
- Quality of hire is not a purely quantitative metric. There are qualitative variables involved. And how these qualitative parameters are calculated may vary from one organization to another.
- Before you get to calculate the quality of hires, you would need to define the exact set of variables that could function as key indicators of the quality of hires. And you need to define the weightage each of these variables would hold in the formula to calculate the quality of hire.
For example, for an organization ABC, the weightage of different predictors of quality of hire (with weightage in parenthesis) could be as follows-
- Core skills (10%)
- Performance weightage (45%)
- Cultural fit (15%)
- Employee retention (10%)
- Employee development (5%)
- Leadership skills (5%)
- Remaining everything (10%)
But for another company XYZ, the weightage distribution, or key predictors might be different-
- Core skills (15%)
- Performance (50%)
- Cultural fit (20%)
- Employee retention (8%)
- L&D (7%)
This is still a simple overview. In reality, the list of pre-hiring & post-hiring indicators of the quality of hire can be too long.
To be honest, it is completely up to an organization’s discretion to decide which factors to include in the formula to calculate the quality of hire. Also, because of the involved qualitative variables, you can’t compare QoH to external benchmarks. It’s a metric relevant only within your organization.
Predictors of The Quality of Hire
In general, recruitment teams use a combination of the following indicators or predictors to calculate the quality of hire-
| Predictors, aka Indicators | Description |
|---|---|
| Pre-hiring Core Skills Assessment Score | A measure of how proficient is the candidate with the skills required to discharge the job duties. This could be the score a candidate obtained in the subject-matter-related assessment tests. |
| Pre-hiring Performance Score | A measure of how good has the candidate been in past jobs; the performance of the candidate so far based on the details revealed in the resume and during the interview. It assigns a score to the relevant achievements of the candidate in his/her career when vetted against the job responsibilities defined in the job description. |
| Pre-hiring Soft Skills Score | This is a cumulative sum of scores for communication, teamwork & collaboration, proactiveness, problem-solving, innovation, creativity, analytical & critical thinking, conflict resolution, integrity, adaptability, flexibility, time management, prioritization, organization, delegation, and other key behavioural, situational, and cognitive aspects that to an extent influences how well the candidate would perform on the job. This score can be computed based on the response of the candidate to the situational and behavioural questions asked in the interview. |
| Pre-hiring Cultural Fit Score | This is a measure of how good a cultural fit or compatible the candidate is expected to be based on the interview and the assessment. |
| Post Hiring On-The-Job Performance | A score to capture the post-hiring efficacy of the employee at delivering expected responsibilities. The pre-hiring counterpart for this was performance estimation. The post-hiring score is the actual on-the-job performance that measures candidates' proficiency with the skills, competencies, and strike rate of delivering responsibilities and achieving project and organization goals. To calculate on-the-job performance, you may need to factor in time to productivity, aka ramp-up time. |
| Post-hiring Value Generation | Every employee is expected to generate more value than the resources invested in that employee. The higher the ROI, the better the hire. Value generation can be mapped in terms of the impact on the bottom line, the contribution to the intellectual property (IP) of the organization, the influence on the talent density, peer engagement, and overall morale of the team, etcetera. |
| Post-hiring Cultural Blending | This is again a qualitative metric that can be measured through detailed surveys, wherein you can ask an employee’s teammates and supervisor or manager about how well the employee has fit into the ecosystem, whether s/he imbibes & reflects the company values, the ethos of the organization…and questions trying to evaluate how precisely the pre-hiring estimations of an individual’s soft skills overlaps with the post-hiring realities. |
| New Hire Employee Turnover Rate | It is an important recruitment metric, which is the percentage of new hires who leave your organization within a set period for evaluation from the date of hire, then be it a voluntary resignation by the candidate or termination from the employer. |
| Employee Retention Rate | It’s an alternative metric for new hire turnover to look at what percentage of new hires stick with the organization for a specified duration of time. |
| Talent Development Score | A measure of how well a candidate is engaging with the training programs, the completion rate of the training programs, the scores obtained, eagerness to pick new skills, enthusiasm to try challenging projects, initiative to take up new responsibilities, and other key things catering to upskilling & development, or to get nurtured for the next line of leadership. |
| Hiring Manager Satisfaction Score | A metric that measures the contentment of hiring managers with the quality of hires. It also reflects whether the hiring manager is happy with the talent sourcing strategies and methodologies leveraged during the hiring process. |
As apparent, there could be a multitude of QoH predictors. If you observed, it’s a mixed bag of qualitative and quantitative recruitment metrics. Thus, it is important to define the methodologies to calculate each of the dependent variables, only then you would be able to accurately calculate the quality of hires.
Formula To Calculate Quality of Hire
Here’s a formula that recruiting evangelists at Skima AI have devised for calculating the quality of hire with normalization and weighted scores of each involved variable-
Step 1: Identify the QoH predictors.
Step 2: Decide on the weightage of each identified predictor for calculating QoH.
Step 3: Define standard methods to calculate each of the predictors identified in step 1.
Step 4: Normalize the value of all the involved predictors to a common scale. often visualized through modern analytics dashboards or GenUI-powered interfaces that help recruiters interpret hiring metrics more efficiently.
Step 5: Use the following formula to calculate the quality of hire.
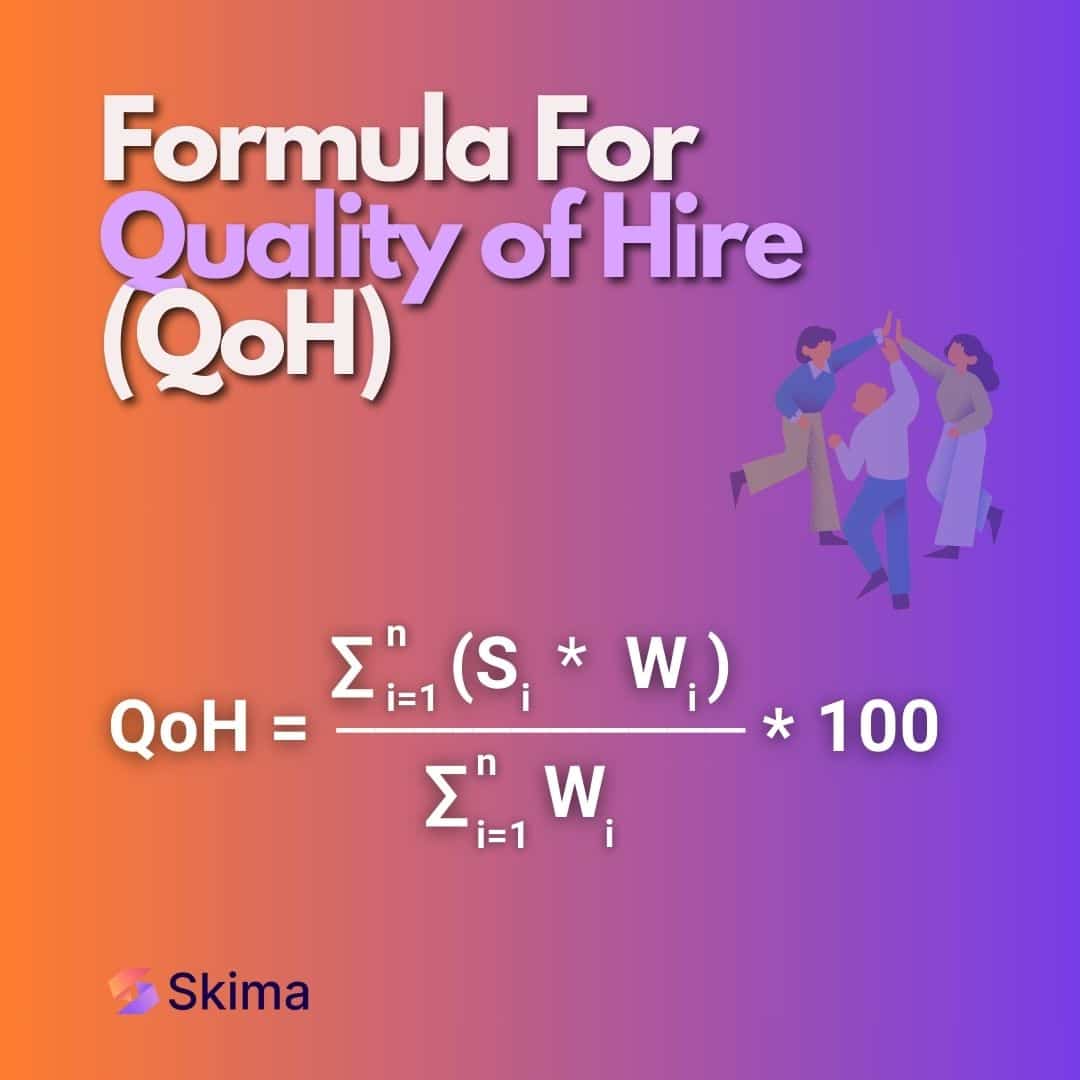
Where,
- i is a placeholder for incrementing the count, which increases by 1 in every iteration of i
- n is the number of variables
- S is the normalized score
- W is the weightage of the variable
Step-by-step Example To Calculate The Quality of Hire
Here’s a hypothetical example for demonstrating how to use the formula for calculating the quality of hire-
Step 1: Identify The QoH Predictors For A Company XYZ.
Assume that the hiring team at XYZ has decided on the following predictors of the quality of hire-
- Core skills (CS)
- Performance (P)
- Cultural fit (CF)
- Employee retention (ER)
- Learning & development (LD)
Note- For brevity, we are keeping the list short. In reality, the list will comprise too many variables.
Step 2: Decide On The Weightage Of Each Identified Predictor For Calculating QoH.
Let’s say, the hiring team at XYZ has a consensus on the following weightage for each of the QoH variables-
- Core skills (CS) - 15%
- Performance (P) - 50%
- Cultural fit (CF) - 20%
- Employee retention (ER) - 8%
- Learning & development (LD) - 7%
Step 3: Define Standard Methods To Calculate Each Of The Predictors Identified In Step 1.
Core skills (CS)
For CS, XYZ does an assessment test every year for each new hire, and assigns a score out of 200.
Performance (P)
XYZ evaluates performance based on the number of sales generated vs the expected number of sales (set goal). Let’s say, the target sales were 30.
Cultural fit (CF)
XYZ assigns a score to each candidate based on team-level employee surveys. This will be a score out of 10.
Employee retention (ER)
XYZ allocates 1 point corresponding to each month of service by a new hire. For this Quality of Hire formula example, the duration of evaluation for the new hires shall be a year.
Learning & development (LD)
It will be the total credits earned in a year by a new hire. The ideal minimum goal at XYZ is 150 credits.
Step 4: Normalize The Value Of All The Involved Predictors To A Common Scale.
The formula for normalization-
Normalized Value = (Value / Actual Value Scale) * New Scale's Maximum Value
For our example, we shall keep the normalization scale as 100 for all predictors, and the score obtained as X.
Accordingly, the normalized formula for each of the identified variables would be-
Core dkills (CS)
(X/200) * 100
Performance (P)
(X/30) * 100
Cultural fit (CF)
(X/10) * 100
Employee retention (ER)
(X/12) * 100
Learning & development (LD)
(X/150) * 100
Step 5: Use The Weightage, And Normalized Score In The Formula To Calculate The Quality of Hire
| Predictors | CS | P | CF | ER | LD |
|---|---|---|---|---|---|
| Base Scale | 200 | 30 | 10 | 12 | 150 |
| Candidate's Score | 134 | 28 | 10 | 8 | 80 |
| Normalized Score on Scale of 100 | 67 | 93 | 100 | 67 | 53 |
| Weightage of Variable | 15 | 50 | 20 | 8 | 7 |
| Weighted Score | 10.05 | 46.50 | 20.0 | 5.36 | 3.71 |
QoH = (sum of weighted scores/total weightage)*100
QoH = (85.62/100)*100 = 85.62%
So, the QoH for this particular hire stands at 85.62%.
Similarly, to calculate QoH for the entire new hire batch, you can use the following formula-
QoH = Sum total of individual QoH of new hires / Total number of new hires
In fact, you can use the above formula to calculate QoH for individual recruiters as well by finding out the average QoH of all the hires by a particular recruiter. This will help find out rockstar recruiters, and underperformers.
End Note
The quality of hire is a tricky yet crucial metric.
If harnessed right, this could give insights into-
- The overall health of your recruitment processes.
- Individual recruiter performances.
- The quantifiable impact you make on the business bottom line as a recruiter.
By the way, Skima AI could be a magic wand in the hands of recruiters who are hell-bent on hiring the best talent. Skima AI has 2 core offerings to recruiters looking to improve their hiring performance and the quality of hires-
Skima AI Job Description Generator
This tool helps you automate job description generation for any role and locality. It is a generative artificial intelligence tool for recruiters and creates stellar job descriptions optimized for high candidate engagement. Try it now for free.
Skima AI Candidate AI Matching Score
This is a brilliant AI recruiting tool for recruiters who don’t want to waste their valuable hours sifting through irrelevant and non-qualified applicants. This tool uses AI algorithms to process resumes and assigns a score to each resume by vetting them against the job responsibilities, requirements, and qualifications. The higher the score, the better the candidate for the job role. Try Skima AI today, it’s free to get started.
If you found this insight to be helpful, then subscribe to the Skima AI blog, and give us a follow on LinkedIn to not miss any hiring & recruiting insight.
Happy recruiting!