













Sync Dashboard and Webhook Logs
Monitor ATS sync activity and webhook events with full visibility into every run, record, and payload directly from Settings
4 min read
- Monitor every ATS sync run across jobs, applications, and candidates from a dedicated Sync Dashboard inside Settings.
- Drill into individual sync runs to see record-level status, timestamps, source IDs, and raw payloads for deeper debugging.
- Track all outbound webhook events from Skima AI to your ATS with status codes, error messages, and full payload visibility from Webhook Logs.
- Get complete operational visibility into how data is moving between your ATS and Skima AI without relying on engineering support.
Full Visibility Into Your ATS Data Flow
Skima AI has added two new logs inside Settings that give admins and technical teams complete visibility into how data moves between their ATS and Skima AI.
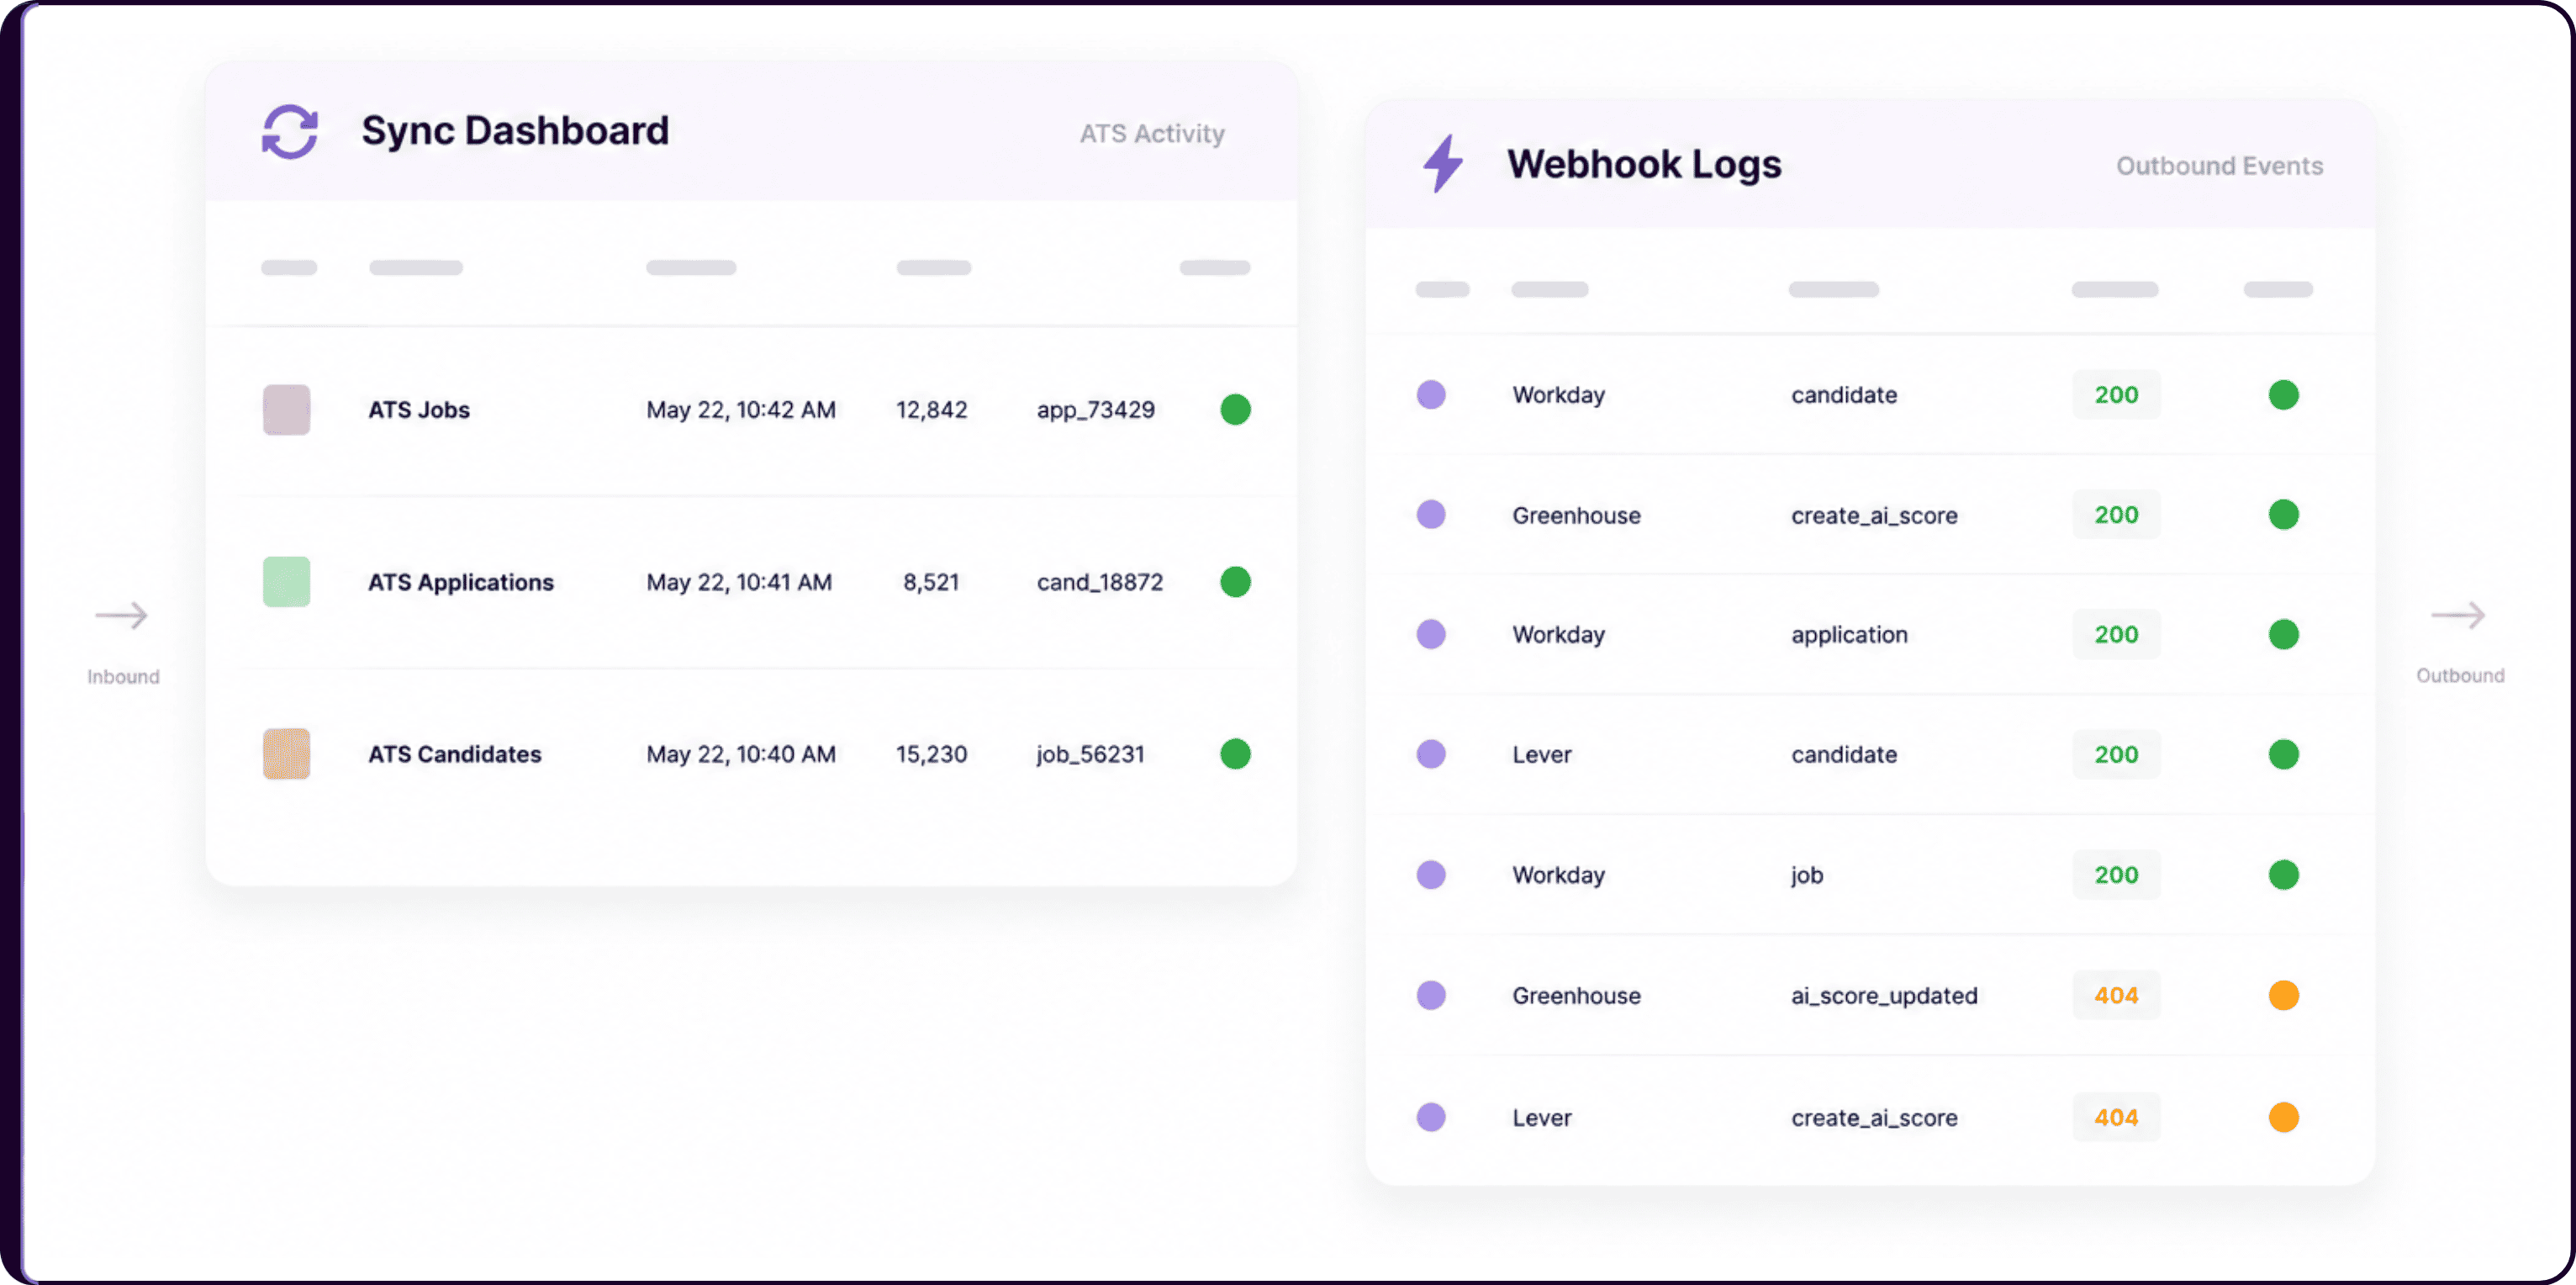 Webhook Logs tracks every outbound webhook event sent from Skima AI to your ATS. Each log entry shows the platform, event type, status code, error if any, and the exact time it was received. Clicking into a log entry opens the full payload with a copy option and a JSON download, making it straightforward to debug failed events or verify what data was pushed.
Sync Dashboard monitors ATS sync activity across three entity types: ATS Jobs, ATS Applications, and ATS Candidates. For each entity, it shows the last run time and status at a glance. Clicking into any entity opens the full run history where each sync run is listed with a start time, completion time, status, and total records processed. Drilling further into a specific run shows every individual record synced in that run, with its source ID, Skima ID, completion status, and a raw payload view for technical inspection.
Together these two logs remove the need to contact engineering every time something looks off in a sync or a webhook push. The information is now directly accessible to whoever manages the integration.
Webhook Logs
- Go to "Settings" from the left sidebar
- Click on "Webhook Logs"
- View all outbound webhook events with platform, event type, status code, and timestamp
- Click any entry to open the full payload, copy it, or download as JSON
Sync Dashboard
- Go to "Settings" from the left sidebar
- Click on "Sync Dashboard"
- View the last run status for ATS Jobs, ATS Applications, and ATS Candidates
- Click on "View details" on any entity to open its run history
- Click into any run to see record-level sync details and raw payloads
Two Logs, One Clear Picture
The Sync Dashboard and Webhook Logs cover two different directions of data flow. The Sync Dashboard tracks what is coming into Skima AI from your ATS, the Webhook Logs track what Skima AI is pushing out. Together they give admins a complete picture of integration activity from a single place in Settings.
Both logs are accessible without additional permissions or developer access. Issues can be identified faster, payloads can be inspected directly, and integration monitoring becomes a routine operational task rather than an escalation to engineering.